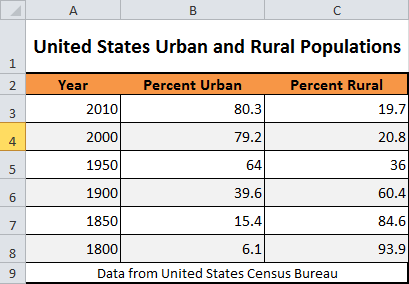
A Simple Table
Data from the US Census Bureau
 <p>United States Urban and Rural Populations
 </p>
 <table>
   <tr>
     <td>Year     </td>
     <td>Percent Urban     </td>
     <td>Percent Rural     </td>   </tr>
   <tr>
     <th>2010     </th>
     <td>80.3     </td>
     <td>19.7     </td>   </tr>
   <tr>
     <th>2000     </th>
     <td>79.2     </td>
     <td>20.8     </td>   </tr>
   <tr>
     <th>1950     </th>
     <td>64.0     </td>
     <td>36.0     </td>   </tr>
   <tr>
     <th>1900     </th>
     <td>39.6     </td>
     <td>60.4     </td>   </tr>
   <tr>
     <th>1850     </th>
     <td>15.4     </td>
     <td>84.6     </td>   </tr>
   <tr>
     <th>1800     </th>
     <td>6.1     </td>
     <td>93.9     </td>   </tr>
 </table>
 <p>Data from
   <a href="http://www.census.gov/">United States Census Bureau   </a>
 </p>
United States Urban and Rural Populations
| Year | Percent Urban | Percent Rural |
| 2010 | 80.3 | 19.7 |
|---|---|---|
| 2000 | 79.2 | 20.8 |
| 1950 | 64.0 | 36.0 |
| 1900 | 39.6 | 60.4 |
| 1850 | 15.4 | 84.6 |
| 1800 | 6.1 | 93.9 |
Data from United States Census Bureau